The Like Log Study is released under Creative Commons Attribution 3.0 license by Yahoo! Labs.
This is an independent copy of the study orginally published at http://ediscope.labs.yahoo.net.
[Single Infographics]
Reference: Yury Lifshits. Ediscope: Social Analytics for Online News. Yahoo! Labs, Tech. Report No. YL-2010-008.
Short URL: http://likelog.yury.name
Contact: yury@yury.name
Released under CC BY 3.0 license
45 sites, 100K+ articles, 40M+ reactions
Three months from 10/2010 to 01/2011
"Total" facebook counts:
likes + shares + facebook comments

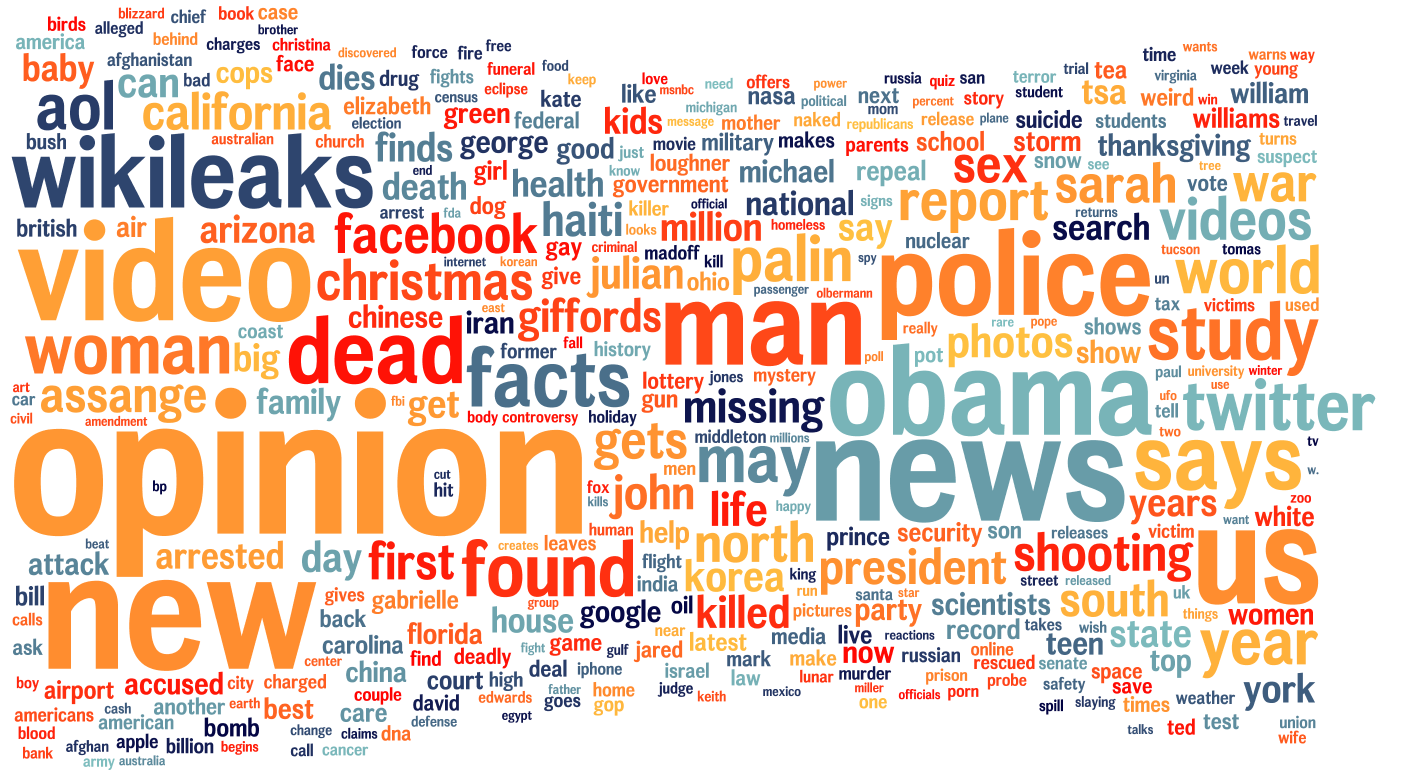
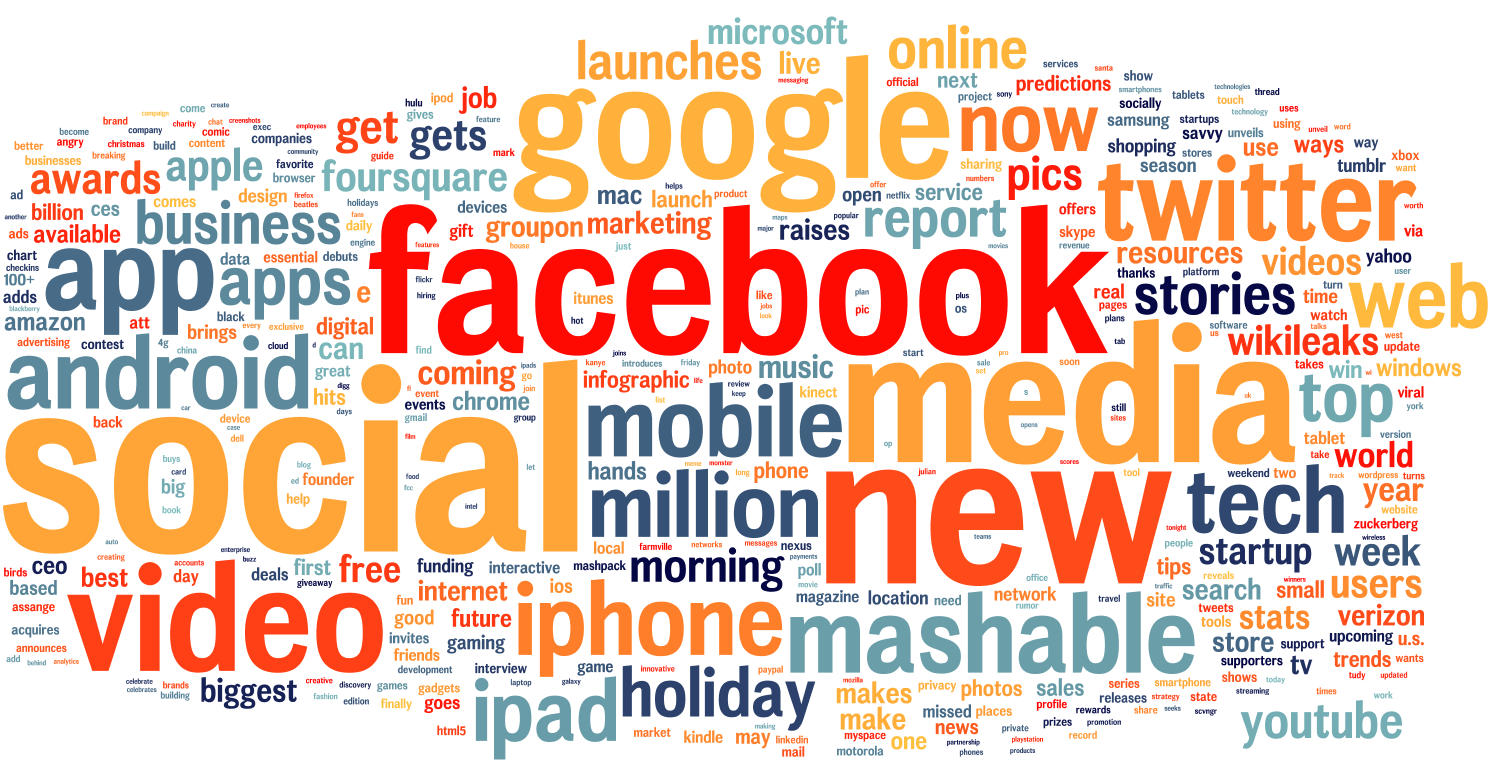
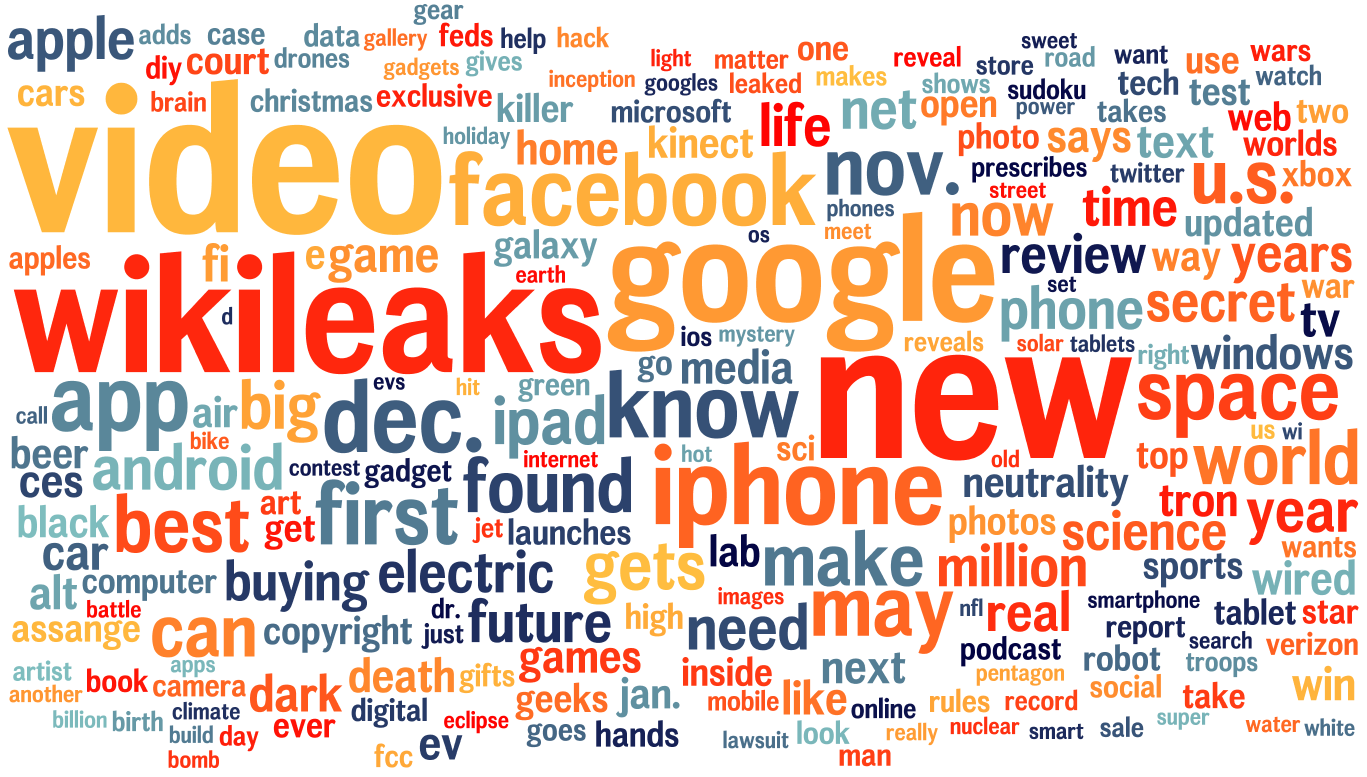
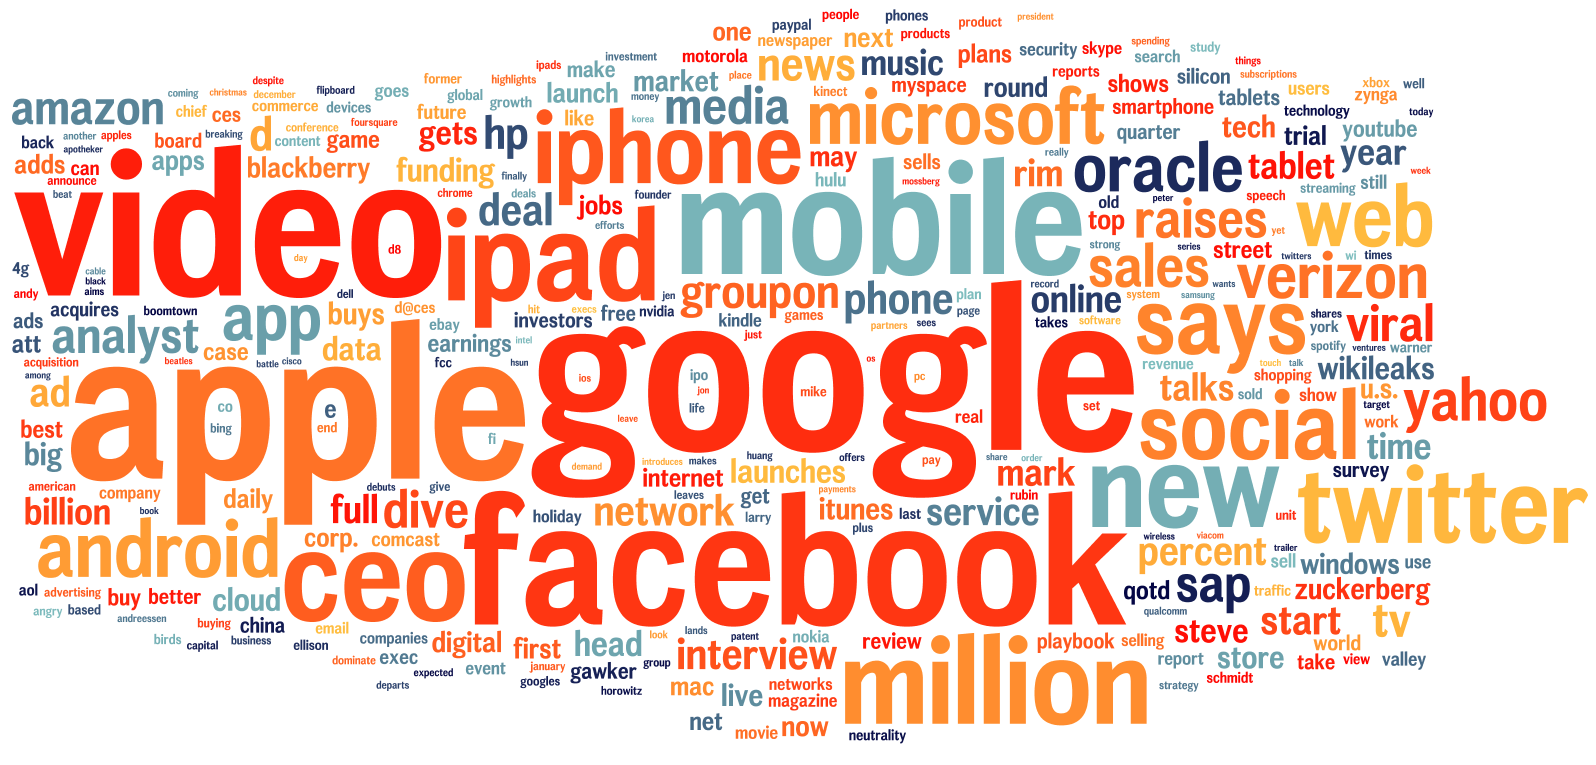
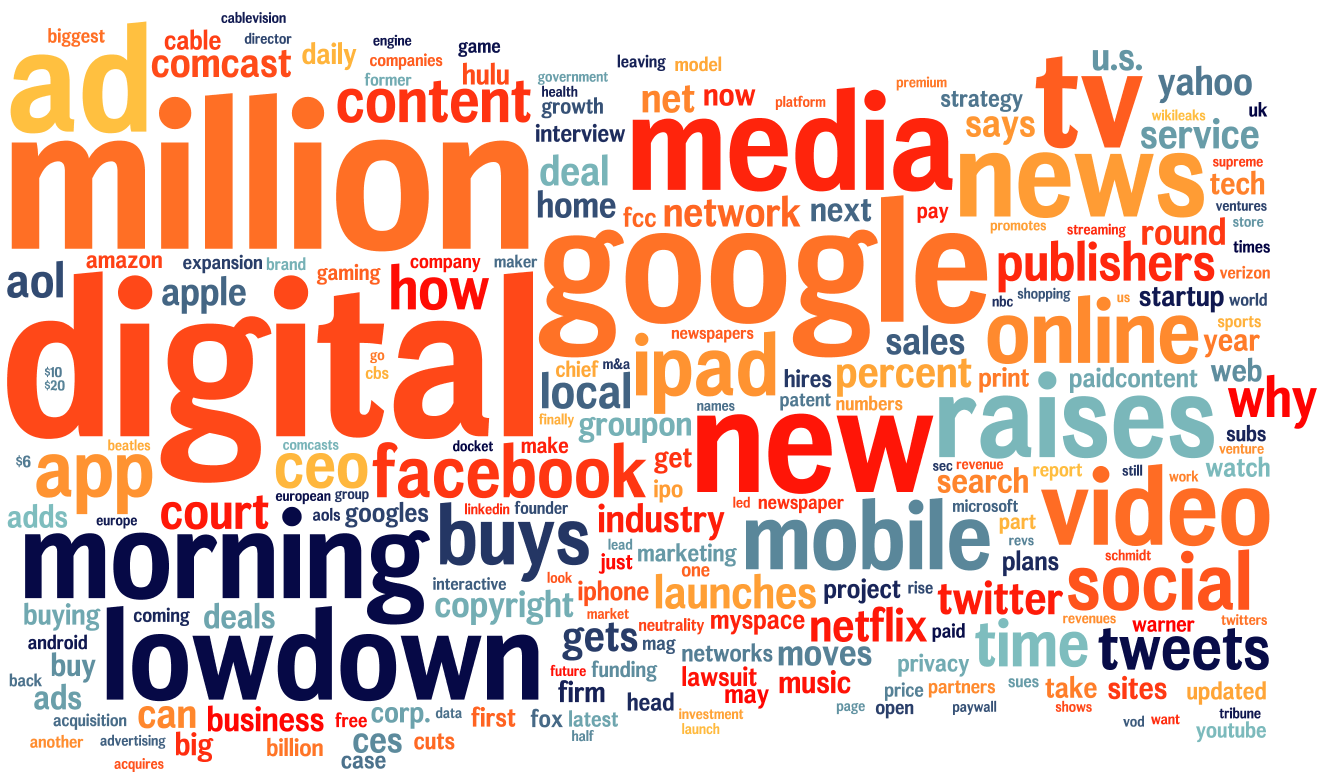
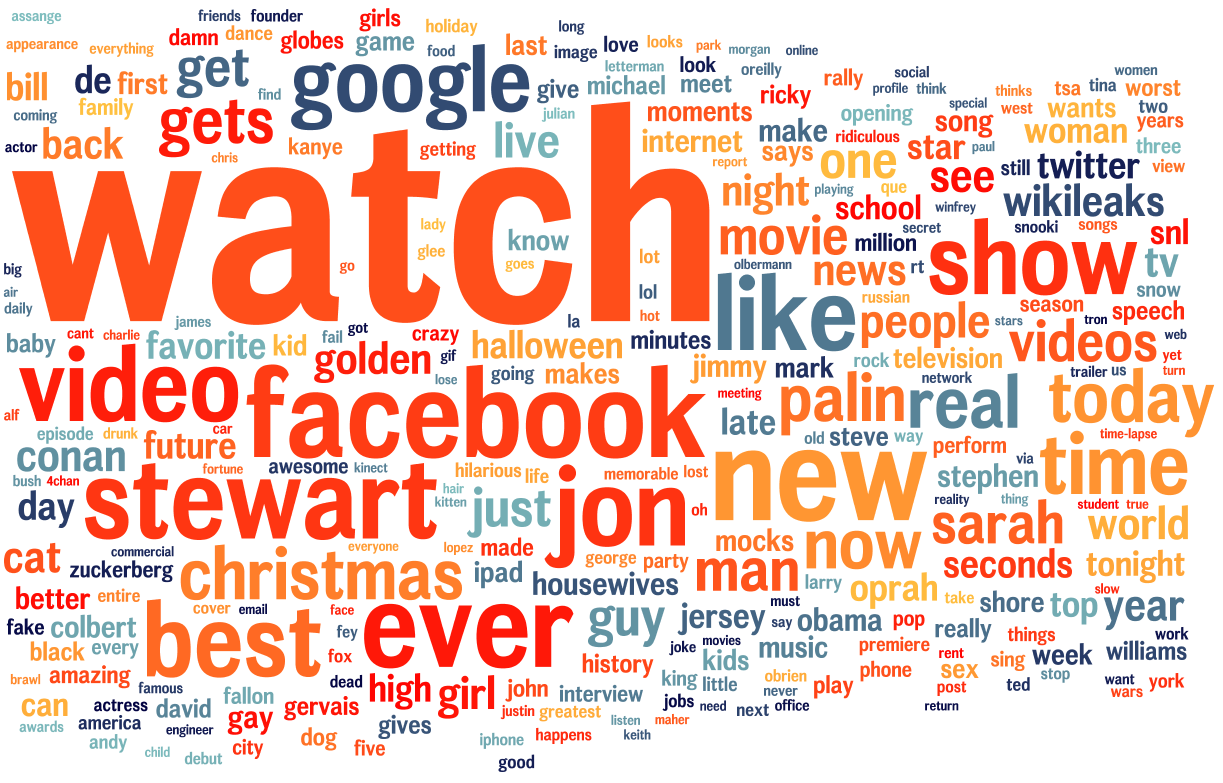
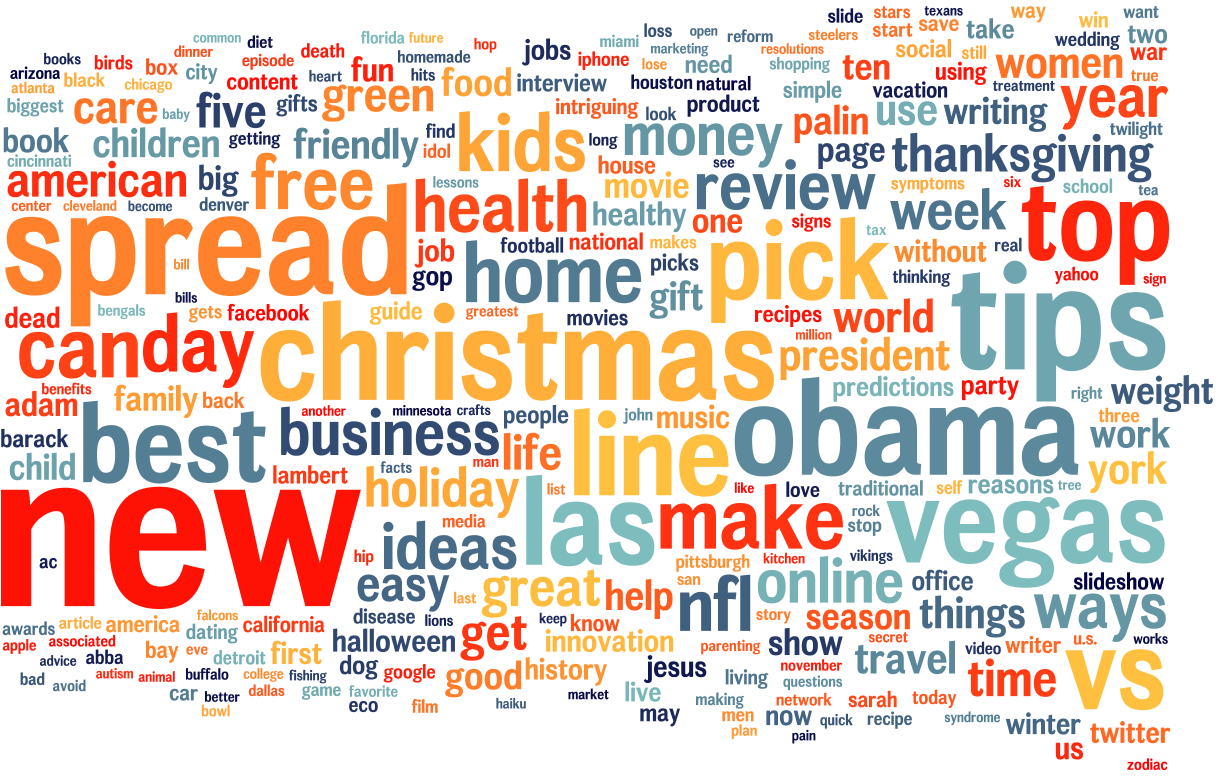
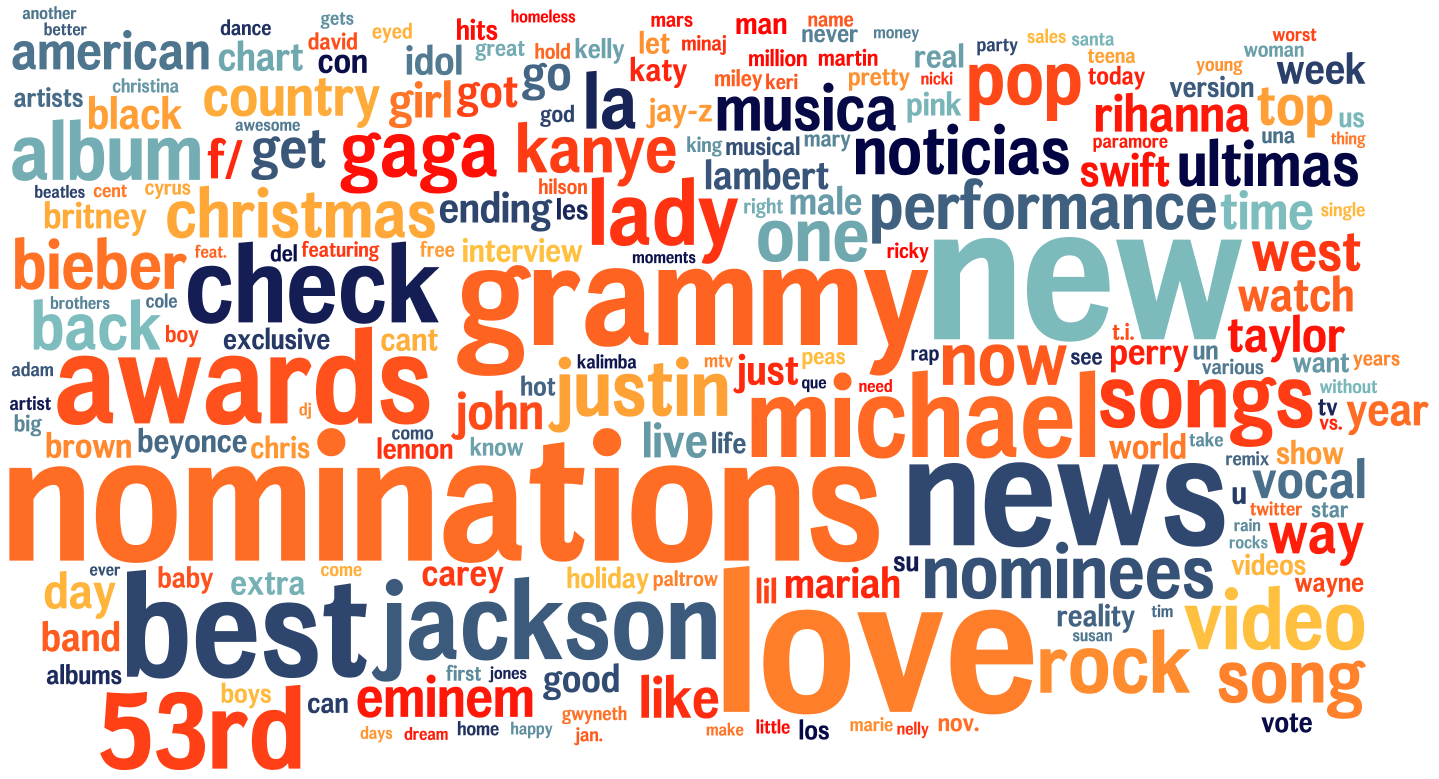
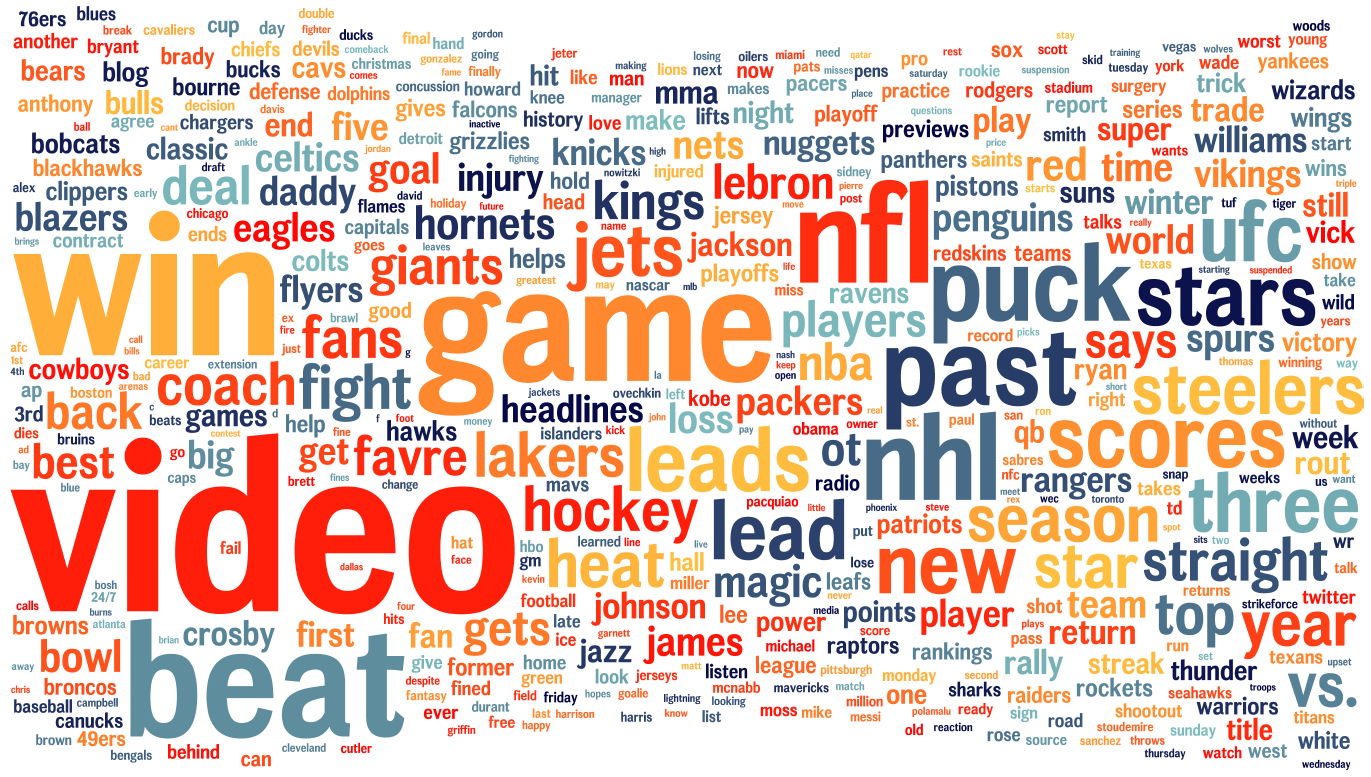
Heatmaps are created with Wordle tool.
This is an independent copy of the study orginally published at http://ediscope.labs.yahoo.net.
[Single Infographics]
Reference: Yury Lifshits. Ediscope: Social Analytics for Online News. Yahoo! Labs, Tech. Report No. YL-2010-008.

Short URL: http://likelog.yury.name
Contact: yury@yury.name
Released under CC BY 3.0 license
The Like Log
45 sites, 100K+ articles, 40M+ reactions
Three months from 10/2010 to 01/2011
"Total" facebook counts:
likes + shares + facebook comments
The Rankings
New York Times is the leader of social engagement with 2.3M likes/month, 400 likes for a median story and 13 articles in top 40. Wall Street Journal story "Why Chinese Moms Are Superior" is the greatest hit with 340,000 likes.The Numbers
There are around 10 likes per 1000 pageviews (across several websites with public PV numbers). Decay of engagement is extremely sharp, with less than 20% likes happening after the first 24 hours.The Trends
Stories about Facebook, Apple, Verizon, Groupon, future and infographics are universally popular across technology blogs. Articles about Microsoft, Amazon, Samsung, cloud computing, TV and search see much less engagement.Recommendations
- Big effort for big stories
- Improve promotion of your best content
- Improve your median story
- Invest in demand analytics
- Invest in social media optimization
The Rankings
Facebook allows anyone to get the total number of likes for any URL.
For this study we collected like counts for 45 popular news sites over the period of three months.
You can sort our collection by any parameter.
| Site | Total likes | Top story | Top 13 stories | Top 90 stories | Median story | # of 3+ liked stories |
|---|---|---|---|---|---|---|
| New York Times | 6815796 | 105289 | 12% | 36% | 398 | 3955 |
| BBC | 4331367 | 140012 | 13% | 38% | 225 | 3867 |
| NPR | 2549613 | 119351 | 18% | 48% | 98 | 2576 |
| The Guardian | 1883161 | 78066 | 21% | 47% | 122 | 2408 |
| Yahoo! Sports | 1774183 | 40490 | 16% | 47% | 32 | 3325 |
| Fox News | 1730704 | 33281 | 13% | 38% | 71 | 3644 |
| Yahoo! News | 1693928 | 42995 | 26% | 60% | 95 | 2476 |
| BuzzFeed | 1479737 | 112289 | 28% | 57% | 60 | 3251 |
| TechCrunch | 1441201 | 7475 | 3% | 12% | 484 | 2595 |
| Yahoo! Shine | 1385644 | 58843 | 29% | 78% | 0 | 751 |
| CNN | 1263924 | 238596 | 42% | 78% | 0 | 690 |
| Wall Street Journal | 1205701 | 342294 | 58% | 81% | 1 | 1353 |
| Mashable! | 1041076 | 69290 | 23% | 44% | 190 | 2035 |
| AOL News | 1010507 | 48115 | 25% | 54% | 43 | 1940 |
| Yahoo! Music | 1002684 | 55338 | 24% | 62% | 28 | 1371 |
| TIME Magazine | 890017 | 328192 | 51% | 72% | 28 | 2709 |
| Yahoo! Movies | 758456 | 42002 | 34% | 80% | 45 | 667 |
| Huffington Post | 710561 | 42005 | 35% | 71% | 25 | 1281 |
| Reuters | 655062 | 152780 | 42% | 67% | 15 | 3281 |
| Engadget | 600962 | 26858 | 16% | 40% | 60 | 2961 |
| The Economist | 593271 | 63317 | 25% | 49% | 97 | 1679 |
| Vanity Fair | 592001 | 44998 | 46% | 80% | 35 | 1027 |
| Forbes | 538588 | 56695 | 47% | 70% | 19 | 2305 |
| Wired | 469834 | 29806 | 25% | 57% | 107 | 1220 |
| Change.org | 400062 | 42310 | 42% | 64% | 42 | 1601 |
| The Daily Beast | 370000 | 14752 | 22% | 49% | 17 | 2140 |
| Bloomberg | 352700 | 15092 | 29% | 57% | 11 | 2906 |
| Yahoo! OMG | 317684 | 23268 | 38% | 73% | 6 | 1929 |
| CNET | 305803 | 11273 | 23% | 54% | 31 | 2028 |
| Gawker | 251199 | 48976 | 53% | 85% | 0 | 563 |
| Yahoo! Finance | 220971 | 30228 | 52% | 97% | 0 | 317 |
| Fast Company | 199552 | 19395 | 29% | 59% | 30 | 1470 |
| Business Insider | 199545 | 13630 | 46% | 76% | 3 | 1239 |
| Good Magazine | 197445 | 7301 | 22% | 51% | 25 | 1706 |
| ReadWriteWeb | 144279 | 13763 | 39% | 60% | 15 | 1676 |
| BNET | 136556 | 13481 | 44% | 70% | 5 | 1540 |
| Business Week | 89036 | 10515 | 33% | 58% | 1 | 1418 |
| eHow | 87843 | 9665 | 44% | 72% | 0 | 945 |
| Inc Magazine | 87540 | 5553 | 29% | 58% | 17 | 953 |
| GigaOm | 64357 | 4284 | 32% | 54% | 6 | 1686 |
| VentureBeat | 51021 | 1804 | 18% | 42% | 10 | 1722 |
| Associated Content | 49383 | 12398 | 77% | 93% | 0 | 405 |
| All Things D | 21502 | 1872 | 43% | 80% | 0 | 401 |
| paidContent.org | 9955 | 942 | 36% | 68% | 1 | 441 |
| Poynter | 8660 | 1207 | 42% | 79% | 0 | 294 |
We use 13 top stories as a model for "one story per week" strategy and 90 stories as a model for "one story per day" strategy.
Top 40 Articles
Among top stories there are only four articles about factual political news
and three about celebrities. The most common type of hit stories is opinion/analysis.
Other common themes include: lifestyle, photo galleries, interactives, humor and odd news.
- 342294 Why Chinese Mothers Are SuperiorWall Street Journal
- 328192 New Zodiac Sign Dates: Earth Rotation Changes Horoscope SignsTIME Magazine
- 238596 No, your zodiac sign hasn't changed CNN
- 164166 A Holiday Message from Ricky Gervais: Why I'm An AtheistWall Street Journal
- 152780 Tired Gay succumbs to Dix in 200 metersReuters
- 140012 Woman in 999 snowman theft callBBC
- 119351 Arizona Rep. Giffords Shot At Public Event In TucsonNPR
- 112289 The 100 Best Signs At The Rally To Restore Sanity And/Or FearBuzzFeed
- 105289 Repeal of ‘Don’t Ask, Don’t Tell’ AdvancesNew York Times
- 85452 Sisters and Happiness - Understanding the ConnectionNew York Times
- 80420 How Obama Saved Capitalism and Lost the MidtermsNew York Times
- 78066 Porpoises rescue Dick Van DykeThe Guardian
- 77965 Detroit in ruinsThe Guardian
- 76432 The Hollywood Issue - 14 Actors Acting - James Franco, Natalie Portman, Matt Damon and MoreNew York Times
- 72421 Video Simon's Cat: Santa ClawsThe Guardian
- 69290 "FarmVille" Interruption Cited in Baby's MurderMashable!
- 68024 Climate of HateNew York Times
- 66205 Budget Puzzle: You Fix the BudgetNew York Times
- 64045 4-Year-Old Can Be Sued, Judge Rules in Bike CaseNew York Times
- 63317 Doctoral degrees: The disposable academicThe Economist
- 62806 Hipster Dinosaurs BuzzFeed
- 59178 Verizon Finally Lands the iPhoneWall Street Journal
- 58923 Our Banana RepublicNew York Times
- 58843 Baring It All: The Barefoot Running TrendYahoo! Shine
- 57386 Congresswoman Shot at Event in TucsonNew York Times
- 56695 Congress Passes Socialized Medicine and Mandates Health Insurance -In 1798Forbes
- 55455 Burma releases Aung San Suu KyiBBC
- 55338 Ricky Martin: 'I Am a Fortunate Homosexual Man'Yahoo! Music
- 54676 During Tonight's Lunar Eclipse, Moon Will Turn Into A 'Reddish Ball'NPR
- 54315 Let It Dough!New York Times
- 54168 Cartoons Invade Facebook to End Violence Against ChildrenMashable!
- 51409 Has Your Horoscope Changed?Yahoo! Shine
- 49157 Snow present in 49 of the 50 U.S. statesCNN
- 48976 4chan on the Hunt for Puppy-Throwing Girl Gawker
- 48115 Lunar Eclipse December 2010 Falls on Winter SolsticeAOL News
- 47970 For Law School Graduates, Debts if Not Job OffersNew York Times
- 47739 Alcohol 'harms more than heroin'BBC
- 45531 From WikiChinaNew York Times
- 45284 Mapping America — Census Bureau 2005-9 American Community Survey - New York Times
- 44998 Justin Bieber on His Musical Inspirations, His Fans, and Trying to Be a Regular KidVanity Fair
Numbers to Know
Social Engagement Per 1000 Pageviews
Some websites display actual number of pageviews for every article.
In this case we can calculate what fraction of visitors is
tweeting or sharing a particular story. Our measurements
show that for every 1000 visits there are from 5 to 20
likes and tweets. Next time you want to guess pageviews of your
competitors, multiply their like counts by 100.

Non-top = all articles except top 10.
Lifespan of a Story
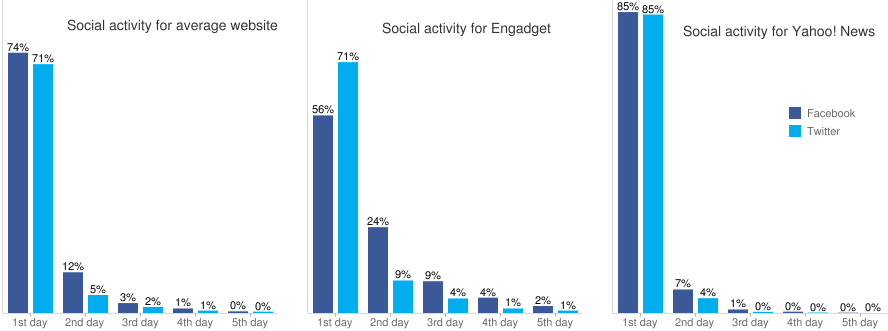
Sadly, web articles are basically lost 24 hours after publication.
Our measurements show that fewer than 20% of likes come after the first day.
Yahoo! News has the sharpest decay of user interest.
Engadget articles have the longest lifespan. But even in this case, new content is only visible for 3 or 4 days.

For this experiment we track articles from each of the following sources: Washington Post, Gizmodo, CNN,
MSNBC, HuffingtonPost, Yahoo News, New York Times, Engadget, Mashable, and TechCrunch.
Note that the total share of activity is significantly less than 100%. This is due to activity in
the interval between the time a story was published and the time we have discovered it.
Engagement Trends
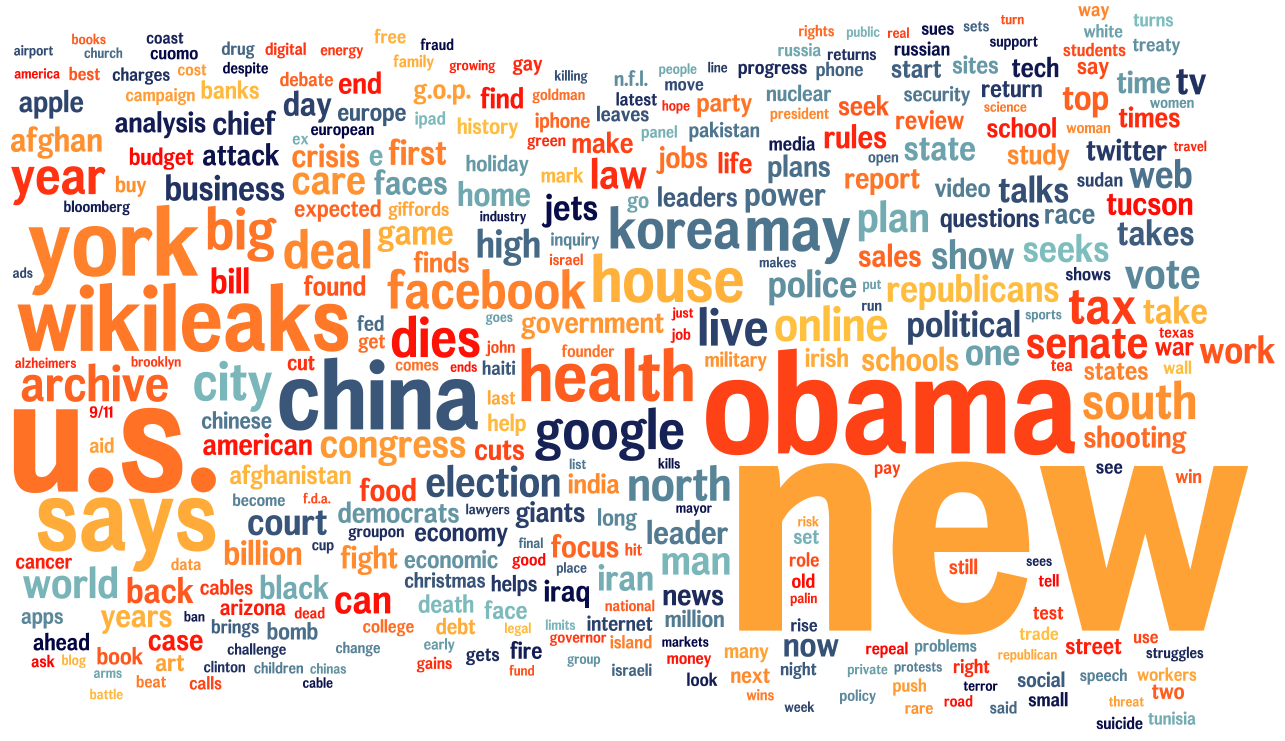
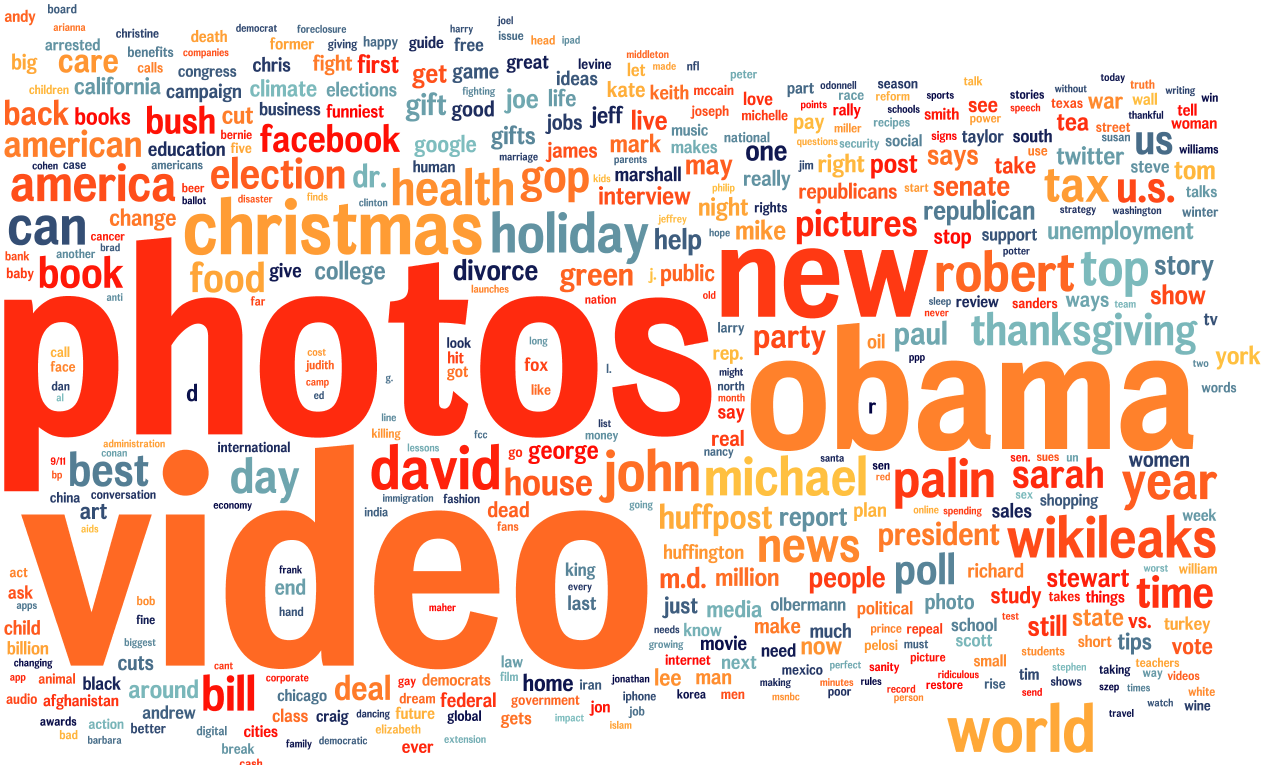
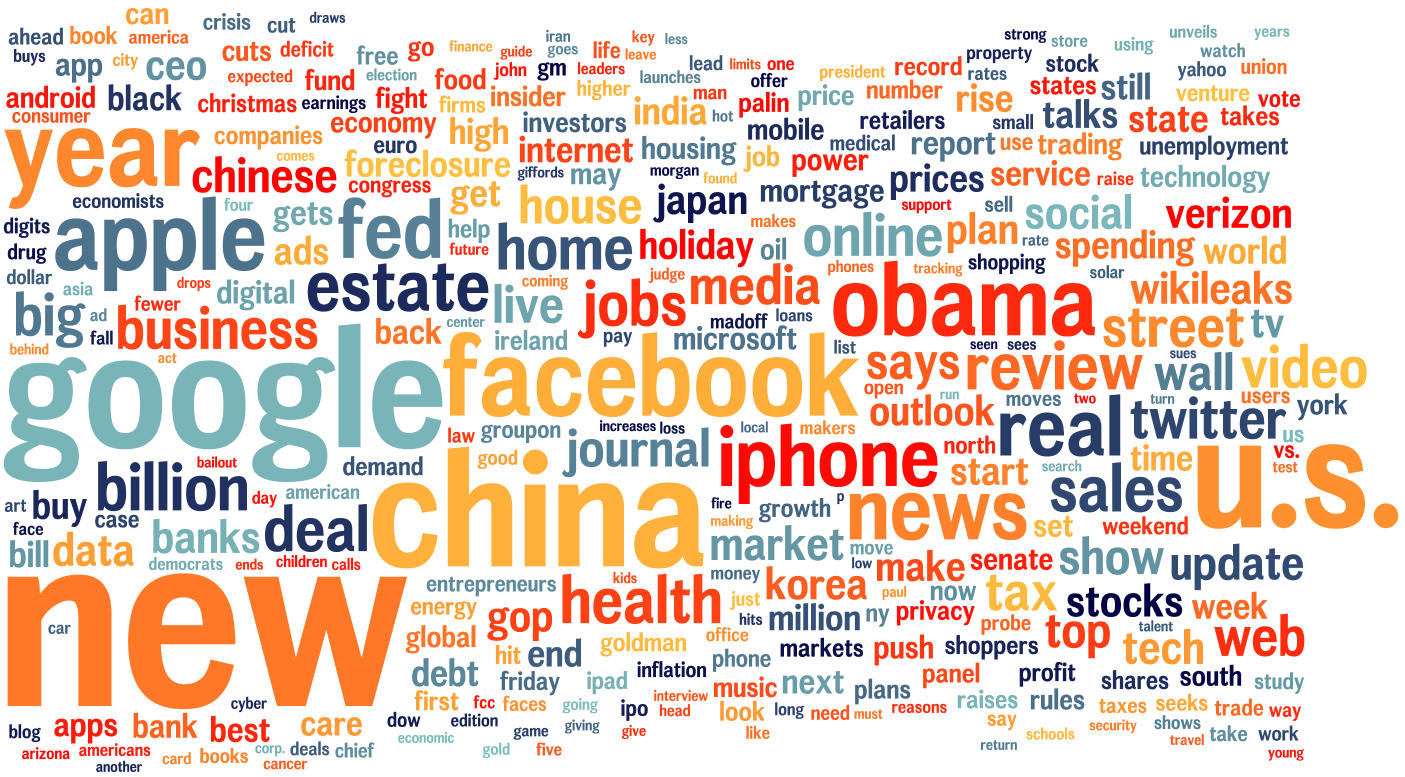
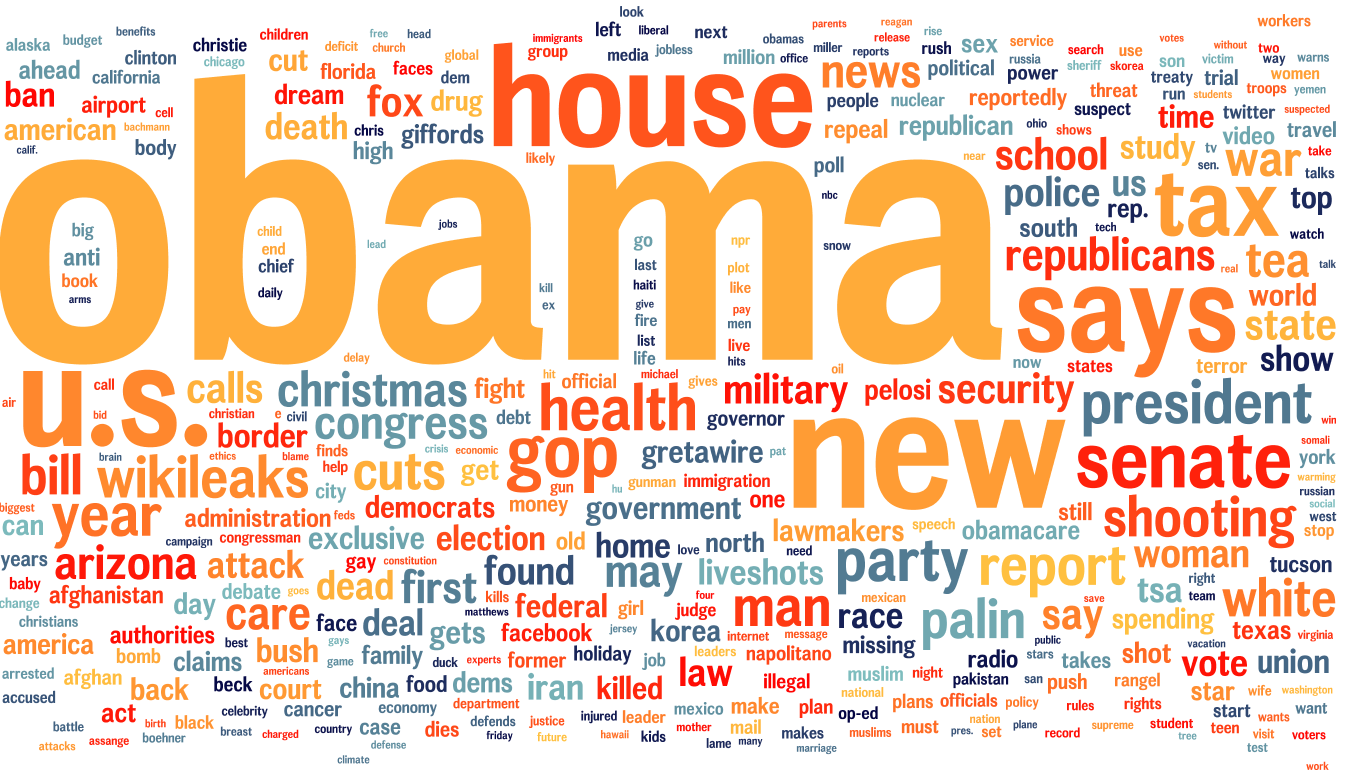
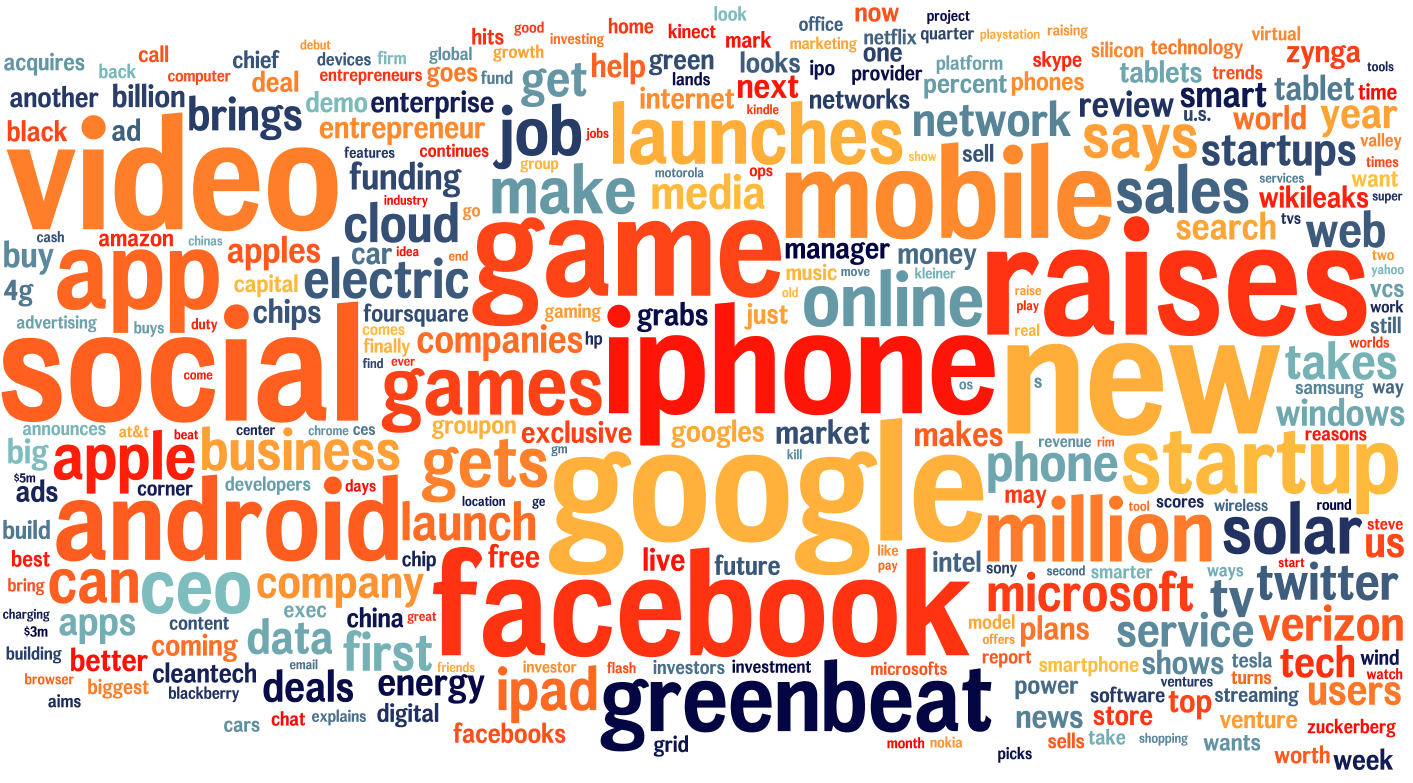
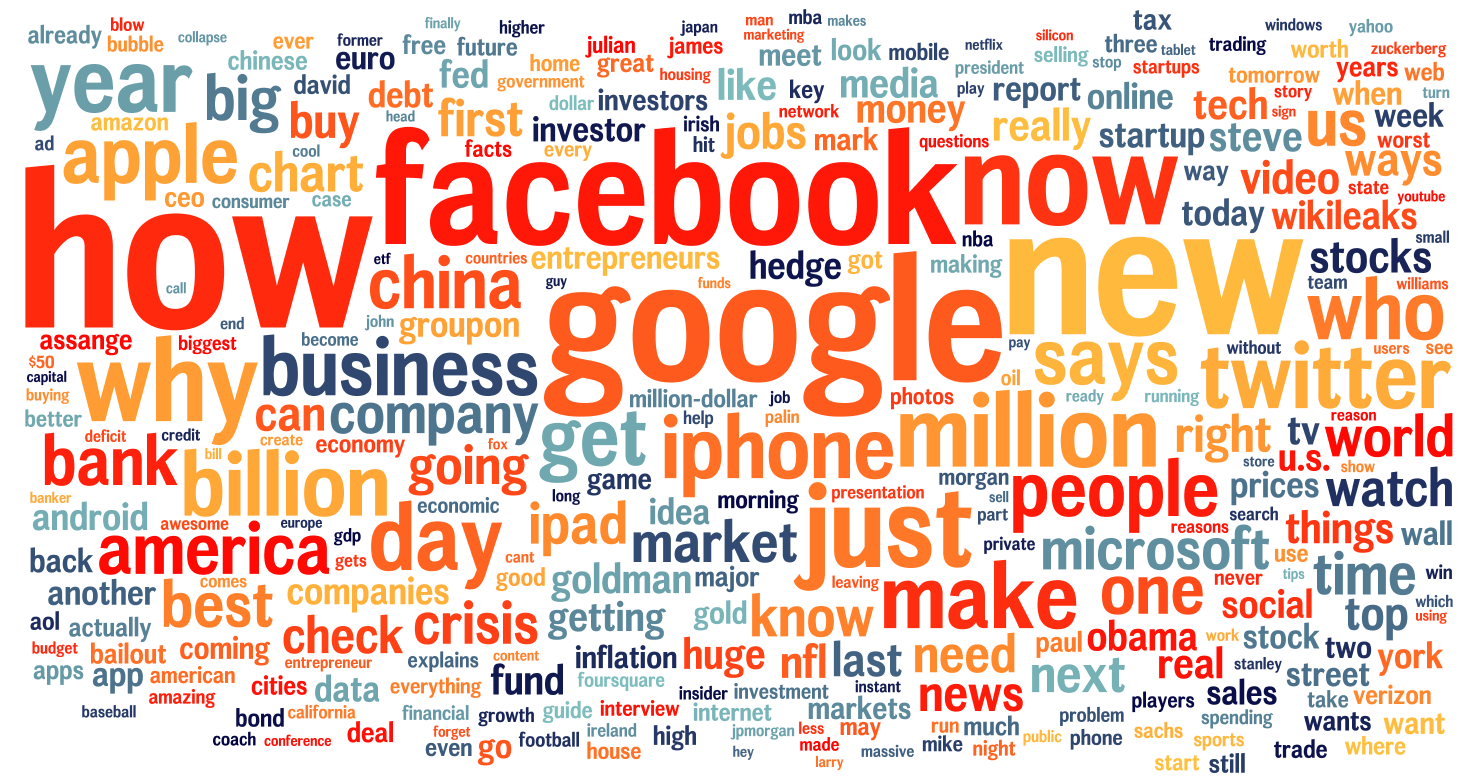
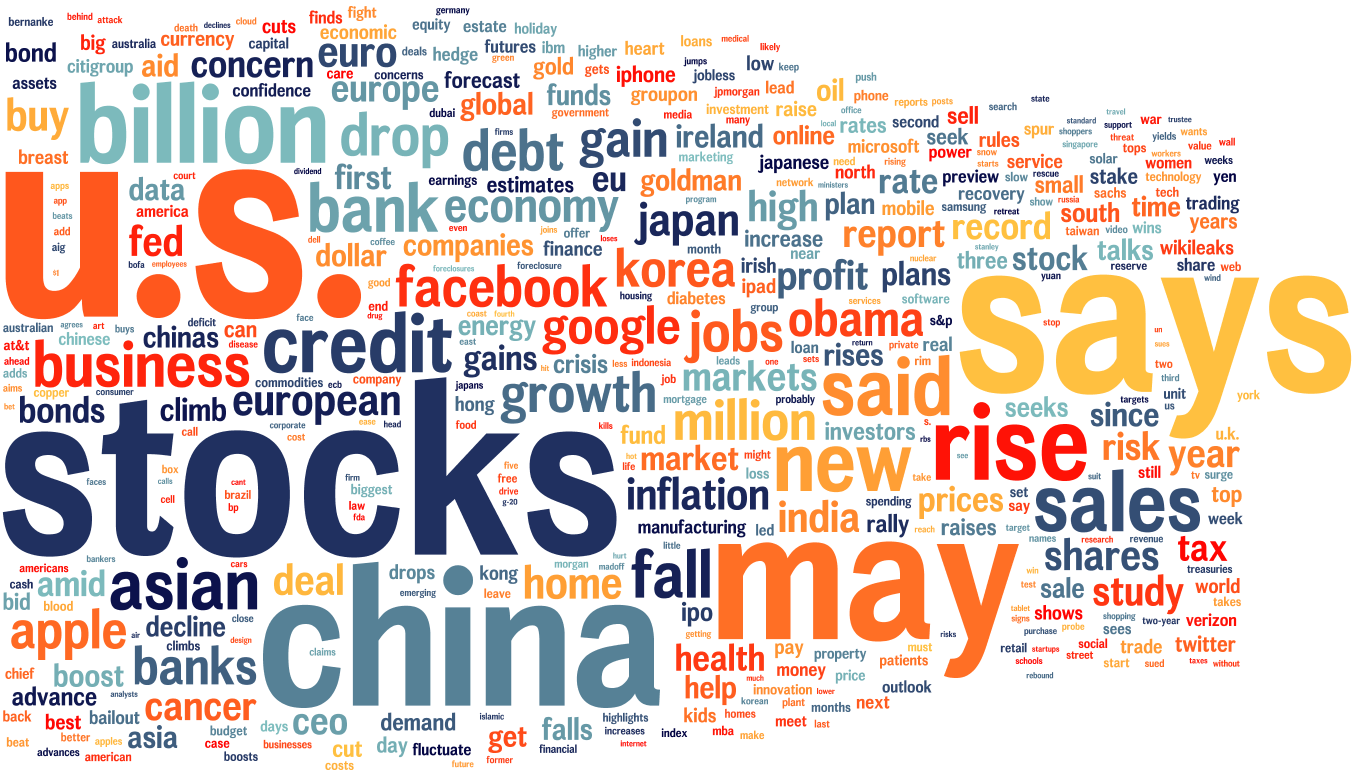
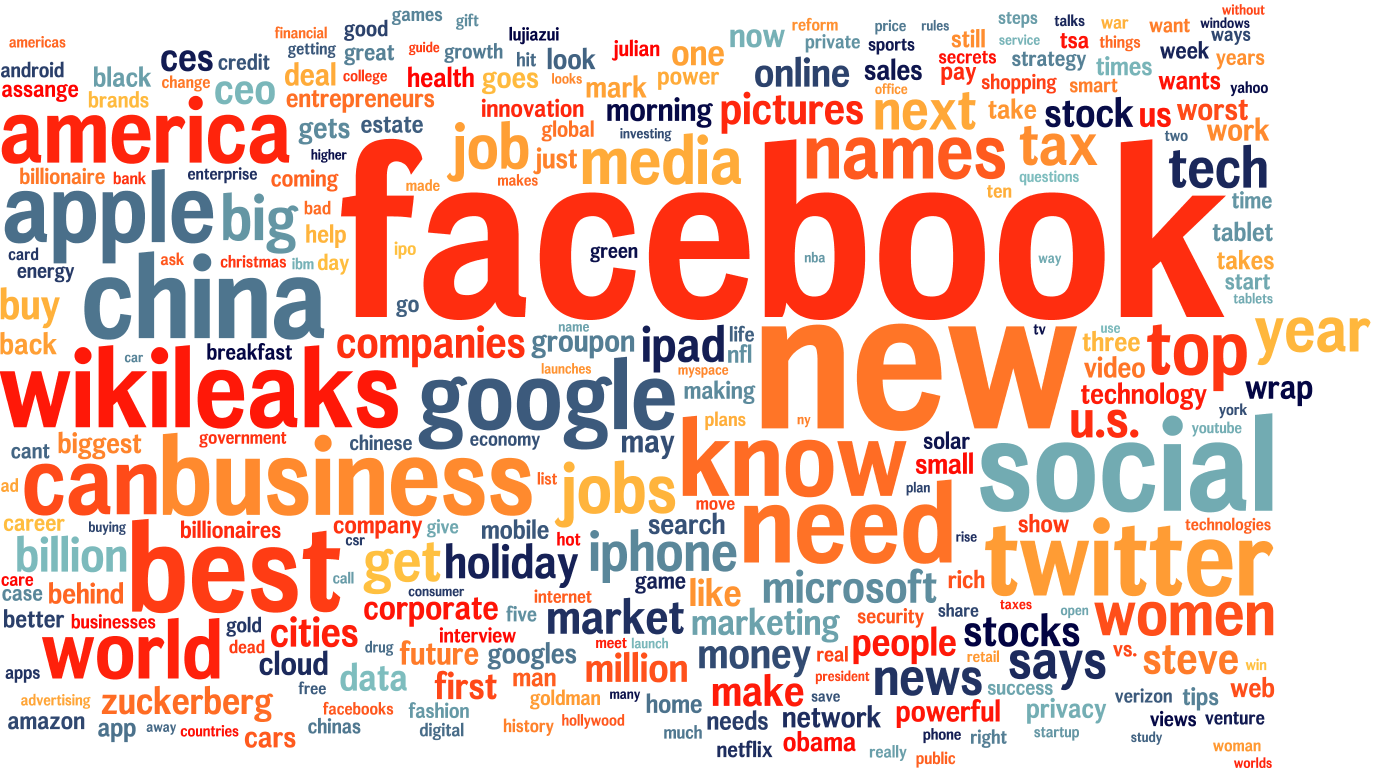
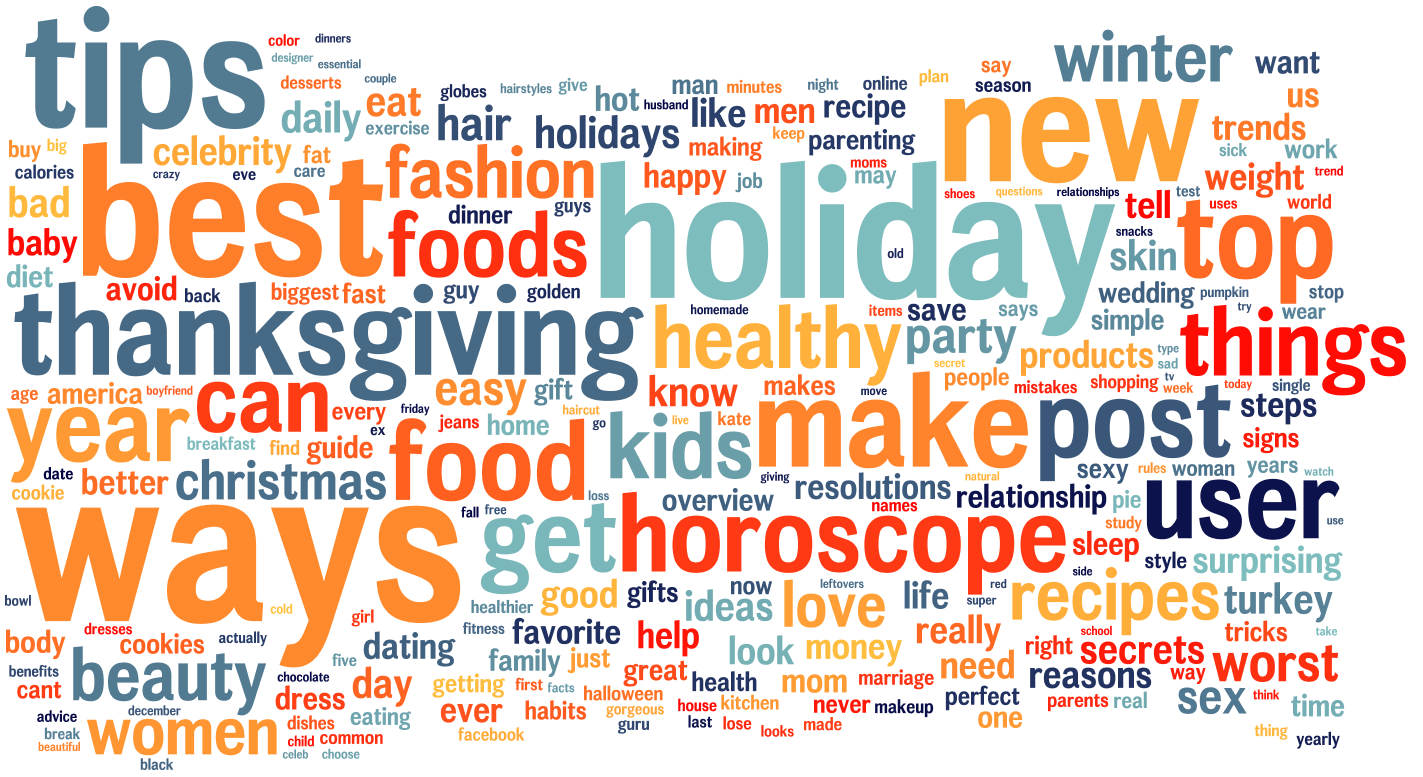
For every site in our dataset we visualize likability of keywords in their headlines.
The size of every word corresponds to number of stories.
The color represents the average number of likes received by stories on a given topic.
Dark blue for the minimum number of likes, bright red for lots of likes.
There are 27 heatmaps in our gallery. Press left and right to see them all.
Few likes  A lot of likes
 A lot of likes
Few articles small big A lot of articles
Engagement for Entites
Here we picked a few brands and visualize their coverage at several technology blogs.
The stories about Facebook, Apple, Skype and Kinect are universally popular.
Coverage of Amazon, Windows and Samsung is much less engaging.
| All Things D | CNET | Engadget | Fast Company | GigaOm | Mashable! | ReadWriteWeb | TechCrunch | VentureBeat |
| iphone | iphone | iphone | iphone | iphone | iphone | iphone | iphone | iphone |
| ipad | ipad | ipad | ipad | ipad | ipad | ipad | ipad | ipad |
| apple | apple | apple | apple | apple | apple | apple | apple | apple |
| wikileaks | wikileaks | ? | wikileaks | wikileaks | wikileaks | wikileaks | wikileaks | wikileaks |
| verizon | verizon | verizon | verizon | verizon | verizon | verizon | verizon | verizon |
| groupon | ? | - | groupon | groupon | groupon | groupon | groupon | groupon |
| itunes | itunes | itunes | itunes | itunes | itunes | itunes | itunes | itunes |
| skype | ? | skype | skype | skype | skype | skype | skype | skype |
| kinect | kinect | kinect | kinect | ? | kinect | kinect | kinect | kinect |
| zuckerberg | ? | ? | zuckerberg | - | zuckerberg | ? | zuckerberg | zuckerberg |
| amazon | amazon | amazon | amazon | amazon | amazon | amazon | amazon | amazon |
| windows | windows | windows | windows | windows | windows | windows | windows | windows |
| ces | ces | ces | ces | ces | ces | ces | ces | ces |
| samsung | samsung | samsung | ? | samsung | samsung | samsung | ? | samsung |
Engagement for Topics
Here is a look at likability/frequency of headline keywords at technology blogs.
Our data shows that keywords 'how', 'why', 'best', and 'future' correlate positively with article success.
'Search', 'tv', 'cloud' have negative correlation. 'Video' is highly polarizing. For some sites, video features are
among most popular items on the site. Others (say, TechCrunch) still have to learn how to turn their video into an engagement leader.
| All Things D | CNET | Engadget | Fast Company | GigaOm | Mashable! | ReadWriteWeb | TechCrunch | VentureBeat |
| video | video | video | video | video | video | video | video | video |
| photos | ? | ? | ? | ? | photos | photos | photos | photos |
| - | - | - | infographic | ? | infographic | infographic | ? | - |
| ? | update | update | ? | update | update | update | update | ? |
| exclusive | - | exclusive | exclusive | ? | ? | - | exclusive | exclusive |
| how | how | how | how | how | how | how | how | how |
| why | why | ? | why | why | why | why | why | why |
| best | best | best | best | best | best | best | best | best |
| future | future | future | future | future | future | future | future | future |
| world | world | world | world | world | world | world | world | world |
| users | users | ? | users | users | users | users | users | users |
| internet | internet | internet | internet | internet | internet | internet | internet | internet |
| social | social | ? | social | social | social | social | social | social |
| apps | apps | apps | apps | apps | apps | apps | apps | apps |
| search | search | ? | search | search | search | search | search | search |
| funding | funding | ? | funding | funding | funding | funding | funding | funding |
| ceo | ceo | ceo | ceo | ceo | ceo | ceo | ceo | ceo |
| sales | sales | sales | sales | sales | sales | sales | sales | sales |
| tv | tv | tv | tv | tv | tv | tv | tv | tv |
| cloud | cloud | ? | cloud | cloud | ? | cloud | cloud | cloud |
| ? | ? | ? | ? | enterprise | ? | enterprise | enterprise | enterprise |
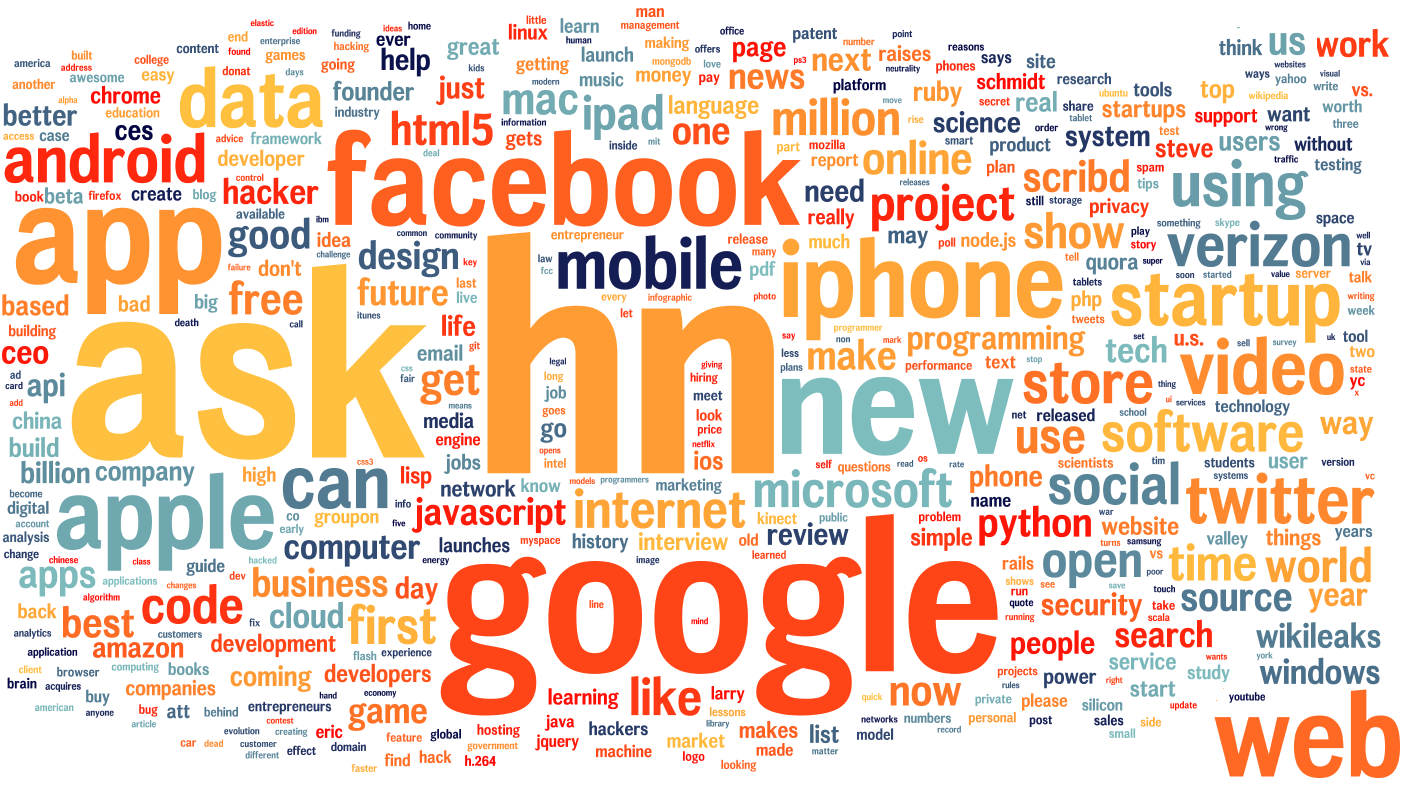
Voting Trends at Hacker News
Engagement trends can be computed from different signals.
Instead of likes one can use tweets or upvotes.
On this chart we show most votable topics at Hacker News site.

few upvotes  a lot of upvotes big: a lot of submissions small: few submissions
 a lot of upvotes big: a lot of submissions small: few submissions
 These voting trends are based on a few thousands recent submissions to Hacker News (news.ycombinator.com).
Five Recommendations
- Put significant effort in your top stories. According to our study, most websites can capture 30% of their total enagement by publishing only ONE story per week! One story per day can capture 70-80% of your audience reactions. But we rarely see web journalists working weeks on a single story. Here are some examples of "big effort for big story": events coverage (Oscars, Superbowl), nominations, awards and voting (Fast Company Influence Project, TIME Magazine Person of the Year readers choice), exclusives (Gizmodo iPhone 4 leak), celebrity Q&A (Obama at Youtube, Beckham at Yahoo! Sports), lists (Forbes Billionaires, Vanity Fair 'Best Dressed'), high-quality infographic & interactives (Good Magazine Transparency blog, NYT 'You Fix the Budget'), trends and predictions (Read Write Web), liveblogging from top events (Apple announcements), op-eds on most controversial issues. Yahoo! Labs have recently published a paper with detailed analysis of hit/niche balance of interests.
- Improve promotion of your best content. According to our measurements, web stories are practically lost 24 hours after publications. Only 20% likes are coming after the first day. This engagement pattern discourages production of "big stories". To get maximum return on your hits, change your frontpage policy. Best stories should be highly visible. Consider hits-only RSS and twitter feeds, month-in-review / year-in-review programs. TechCrunch Classics is another example of hit promotion. And internal efforts are not enough. Breakout success comes when other media (top TV networks, newspapers and magazines) are picking your story and link back to it.
- Improve your median story. Sort all your stories by engagement and pick a story right in the middle of the list. This is called a "median". A median story has less than 50 likes for majority of websites in our study. In other words, every second story takes more effort from a writer than it brings value to the readers. Recently leaked "The AOL Way" reports their median story to have only 1500 pageviews, and they aim to grow it four times. Publishers should ask themselves: Why do we write so many weak stories?
- Use both intuition and algorithms for demand analysis. Some say that best writing can only come from internal compass. Others are writing new articles in direct response to search queries. The key to success is likely somewhere in between. In ideal settings the writers have full control but they are equiped with great tools to navigate content demand. Up to this moment most demand tools were based on search data and internal metrics. The Like Log presented here is a new approach to demand analysis. Likes represent so called "interest graph", the map of world interests. You can understand your readers better by using our engagement trends technology. And you can get insights into audience of your competitors, too.
- Invest in social media optimization. According to our numbers, you should get around 5-20 tweets and likes per 1000 pageviews. If you have less than that, your social distribution is suboptimal. Create different designs for sharing and subscription functionality and split-test them to find the optimal one. Also, make sure to have just one URL for every story and slideshow. Otherwise, your enagement numbers get scattered among article duplicates. Social networks are likely to be a bigger traffic driver in the future. Combining our data with Comscore, we see that average New York Times reader makes only ONE like per year. We expect this number to go up significantly.
Pointers
Check out the follow ups for this project: How to do a social media check up for your site?
and Ideas for like-log-based research projects and web services.
Any feedback is highly welcome. Further updates will be announced at @yurylifshits.
Contact Yury at yury@yury.name or @yurylifshits


